Hello! First, we’re glad you found our earlier answer helpful.  Thanks for writing with your new question.
We have a few things to offer you. First, if you ever need to see what a function’s graph looks like, we strongly recommend using Desmos.com as a tool. Just click the “Graphing Calculator” button that’s there and enter the function you’d like to plot. It’s free and super-easy to use, and quite amazing since you can graph nearly any function – although you do have to be a bit careful, a warning I’ll come back to below.
For now, let’s focus on what your teacher is asking you to do. First, just to make sure you know how to complete the table: With your calculator you’ll calculate the various values to enter in the boxes. For instance, in the first box for x = \mp 1 you would compute
\begin{align*}
\text{For } x = -1: &&\quad\dfrac{\sin(-1)}{(-1)} &= - 0.841 \\[8px]
\text{For } x = 1: &&\quad\dfrac{\sin(1)}{1} &= 0.841
\end{align*}
IMPORTANT: To obtain the correct values, make sure your calculator is set to radians (rad), and not degrees (deg).
Then in the next box you would compute \dfrac{\sin(-0.5)}{(-0.5)} and \dfrac{\sin(0.5)}{(0.5)}, and so forth to complete the table.
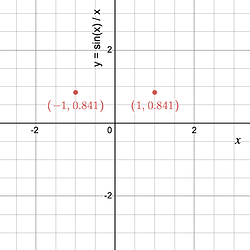
Next, to sketch the graph, first plot the points (-1, -0.841) and (1, 0.841):
Continue with the other points from your completed table, and then draw a rough curve to connect those points (leaving out x = 0, since the function is undefined there). You’ll see that I used Desmos there to start the graph, but you could of course use graph paper and plot the points by hand if that’s what your instructor expects.
This question is actually about \displaystyle{\lim_{x \to 0} f(x).} If you’re having any trouble understanding what’s going on with limits and why we care about them, I’d like to suggest that you start with our Limits Introduction on the main site and work forward from there. Other students have found those screens very helpful for learning what a limit actually is. (And since the idea of ‘the limit’ is the foundation for all of Calculus, it’s really important!)
If you work through the screens that come after that, you’ll see that we examine the particular limit \displaystyle{\lim_{x \to 0}\dfrac{\sin(x)}{x}} as Function #2 on the screen Some Limits that Exist; Some that Do Not. I hope you’ll be able to see how your instructor’s question is asking you to use your graph of plotted points to guess at the result that’s there.
In case it’s helpful, here’s a live Desmos graph that I used to generate the plot above, and you can do your calculations there too if you’d like as you’ll see. If you click the open-circle next to the top line f(x) = \dfrac{\sin(x)}{x}, you’ll see the plot of that function.
To finish,one very important warning about Desmos: while it’s amazing in many ways, it can mislead you, too. In particular here, if you have it plot f(x) = \dfrac{\sin(x)}{x}, you’ll notice that it looks from the graph like f(0) = 1 … but of course you know that you can’t divide by zero, and so the the value at x = 0 is actually undefined. Indeed, if you make the plot and put your cursor on the curve at x=0, you’ll see that the label of that point is (0, undefined), which is correct, but it sure looks like that that point is there on the graph. So you have to be careful when you rely on Desmos, or any other graphing calculator, about where functions are actually defined and where they are not.
I hope that helps. Of course please let us know if you have any follow-up questions about what I’ve written or the Desmos graph, or about anything else we might help with! 

